Build a Power BI Financial Data Model with your QuickBooks Data - Video Course
Build a Power BI Financial Data Model with your QuickBooks Data - Video Course
Couldn't load pickup availability
You don't need to know any fancy formulas or complex database terminology to take this course. I'm not trying to dazzle you with colorful graphs and charts. I simply put the power to customize and automate your financials in your hands! And every report we make will tie out to your accounting data.
I break everything down for you step-by-step and show you how to complete each step with a sample QuickBooks file - using both the QuickBooks Online and QuickBooks desktop versions.
Even if your data is in another accounting package than QuickBooks, the process will be the same for any accounting dataset. What you learn will translate to any accounting software. (I even show you how you can build P&Ls if all you have is an excel file of transactions coded to account numbers!).
This is a class specifically designed for business users with entry-level Power BI knowledge — by an Accountant, for Accountants — that walks you step-by-step through:
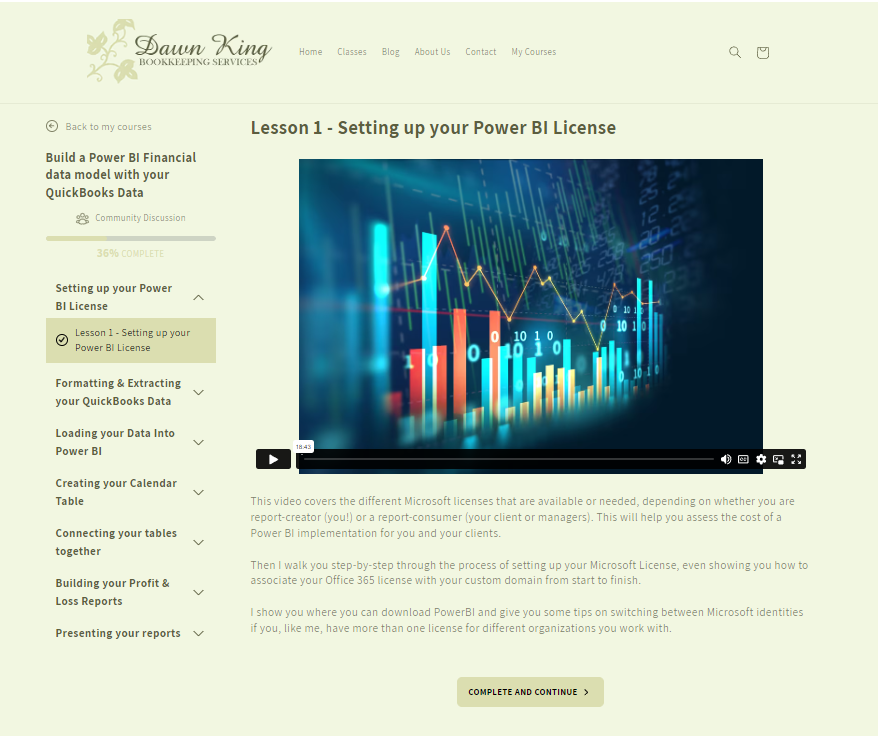
- Choosing which Power BI license you & your report viewers need and how to set it up.
- Formatting and extracting your QuickBooks data for easy reporting in Power BI.
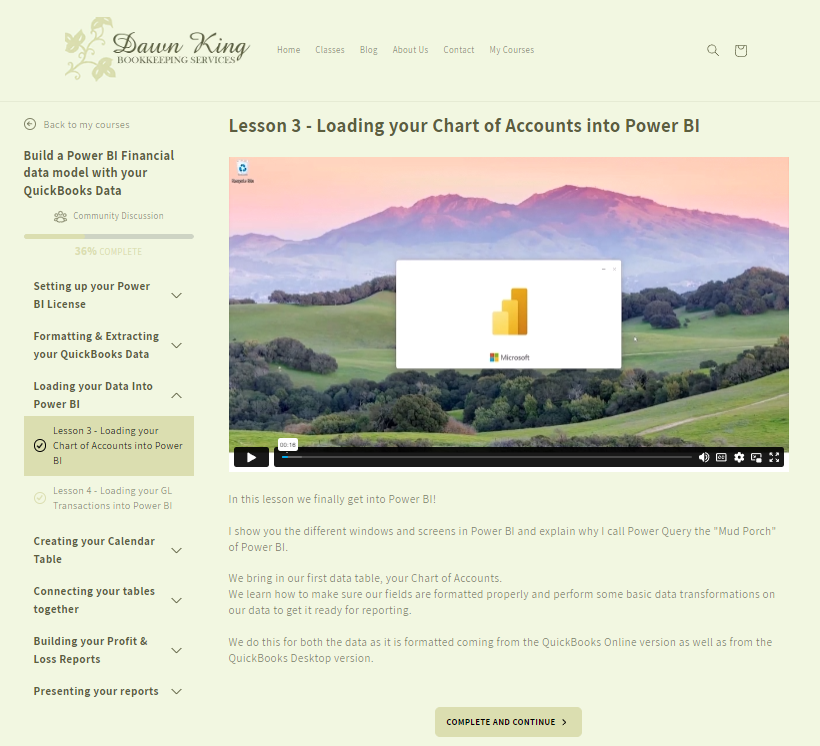
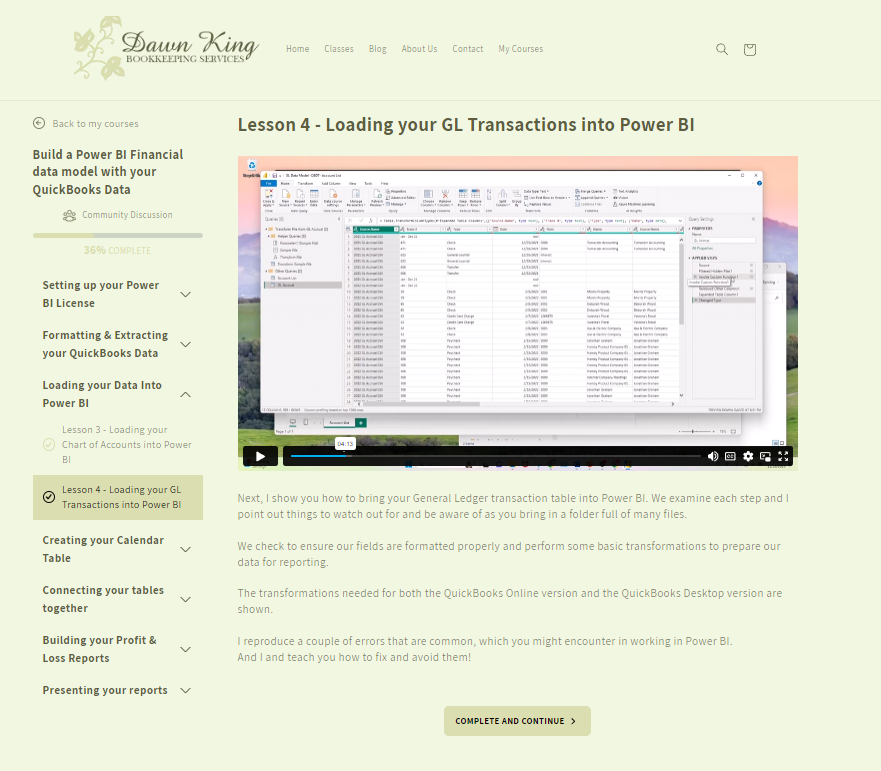
- Setting up your General Ledger data in Power BI and ensuring it is all formatted properly for reporting.
- Building the Date Table you need to run reports on a Calendar year or a Fiscal year/monthly/quarterly basis - fast and easily! Without using complex time-intelligence functions.
- Building the Headers you need to automate 3 versions of your Profit & Loss Report:
The Standard QuickBooks Version, The EBIDTA Version and a Gross Profit Analysis Version - where I show you how to separate your Gross profit section so you can see the gross profit on different lines of service at a glance.
- Building the Measures (formulas) you need to automate the comparative P&Ls that help you compare your data:
MTD, YTD, Last YTD, Last Year, % of Income and % of difference between periods
- I show you how to format your Power BI Financial Statements for presentation to your stakeholders and teach you 3 different ways to deliver them, depending on what you, your managers or clients prefer:
You learn how to control workspace access in PowerBI Online, and the various ways to bring your Power BI dataset into Excel
When you complete this 4-hour course you will be able to make a data model from your own QuickBooks data and begin generating customized, automated Profit and Loss reports immediately.
I am here for you every step of the way. Contact me anytime with questions and for consulting support for you or your administrative team.
Share